From funding sources to reporting, bringing together the SAFe canon, community contributions and practice
This article brings together the sources scattered across the SAFe ecosystem on funding sources, the use of funds and reporting into a coherent financial management perspective. It shows how portfolio budgets, investment decisions, capacity consumption and economic feedback connect, while distinguishing framework requirements, complementary approaches and my own conclusions.
It gives (A)SPCs and SPCTs a basis for working with Finance on the financial side of their transformations: Which decisions are made at which level? What is funded, what is prioritised, and how is economic success assessed?
The article makes this perspective concrete through four recurring points of friction: the portfolio as a portfolio of investments, the CVS example as a transitional arrangement, planned-versus-actual comparisons at Feature level, and economic prioritisation using relative WSJF or monetary Cost of Delay. The aim is to make the respective decision logic and its limits visible.
What the article does not provide is a concrete tool for implementing this in your own company. It is a starting point for understanding finance in SAFe. I will address that gap in a subsequent article.
I would like to start by defining a few terms for the purposes of this article:
- Value Stream: a long-lived organisational unit that develops and operates one or more products. The enterprise funds portfolios; the portfolio allocates its budget to Value Streams. The Value Stream is therefore the unit that receives and spends a budget.
- Agile Release Train (ART): a stable team of teams (typically 50–125 people) within a Value Stream.
- Planning Interval (PI): the planning and delivery cadence, usually 8–12 weeks.
- Epic: a major undertaking with its own benefit hypothesis, comparable to an investment initiative but without its own project budget.
The financial flow at a glance
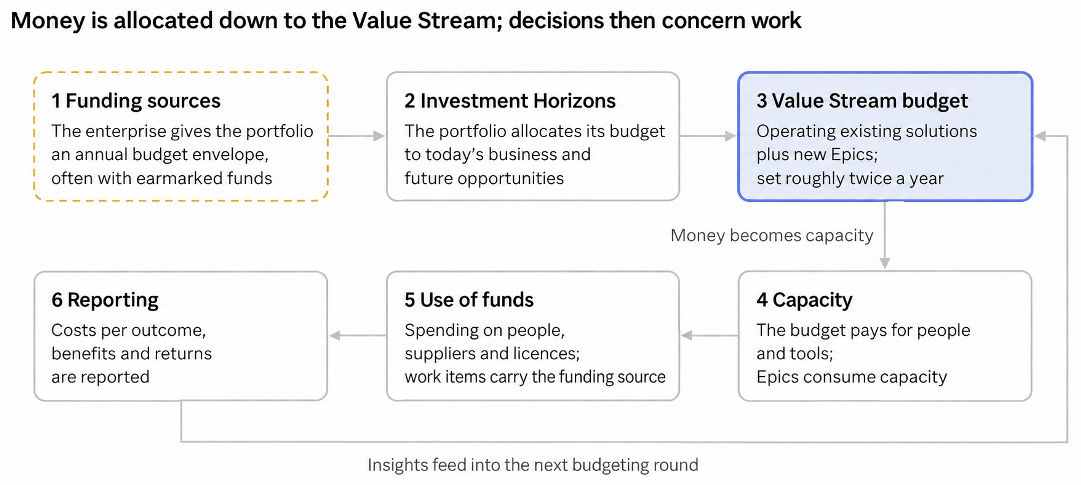
Financial flow in SAFe · 6 stages, 1 feedback loop
Money becomes capacity. Up to Stage 3, management is in monetary terms; from Stage 4 onwards, it is in terms of capacity. The dashed outline marks the only stage that the SAFe canon does not fully describe; community contributions provide answers here.
A portfolio of investments, not work
To understand the financial flow in SAFe, we first need to understand what kind of portfolio we are looking at. A Lean Portfolio (SAFe portfolio) is a portfolio of investment alternatives at different stages. SAFe explicitly compares a Lean Portfolio to an investment portfolio that allocates funds across, among other things, asset classes (Lean Budgets). It calls Epics «some of the most significant business investments» and stresses that they are «not merely financial allocations» (Epic). Portfolios treat Epics as «hypothesis-driven investments» (Validating Investment Opportunities).
Brian Tucker, a SAFe Fellow and one of the earliest SPCTs, accordingly begins his blog series «On the Nature of Portfolios» with the portfolio as an investment vehicle (Participatory Budgeting). Tucker’s contributions are not part of the SAFe canon and are treated here in the same way as community contributions.
For me, the difference between Lean Portfolios and traditional project portfolios is that the latter focus first on work or outputs.
The perspective changes the questions we ask of the portfolio:
| Portfolio of work | Portfolio of investments | |
| What it contains | Programmes, initiatives, projects and assignments | Outcome hypotheses validated through MVPs |
| Guiding question | How much work is there, and how do we deploy our people most effectively? | Which investment delivers the highest return, and over what time horizon? |
| Management metric | Utilisation, schedule, adherence to budget | Return, time to benefit, learning progress |
| What happens when signals are poor | Corrective action to stay on plan | Reallocate funds or stop the flow of funding. |
For the financial flow, this means that an Epic is an investment authorised to consume capacity. The Value Stream budget pays for the capacity; the decision concerns the Epic as an investment.
My understanding is this: a portfolio’s ultimate purpose is to implement the enterprise strategy while using resources efficiently.
In SAFe, the portfolio funds strategy implementation. It decides which investments may be started or continued and thus consume capacity. When you look at the Portfolio Kanban (Portfolio Kanban), Epics already consume a small amount of capacity in Review and Analysis, for example for limited research spikes, customer validation and the Lean Business Case. When an Epic moves into Implementing/MVP, the Epic Owner works with Product or Solution Management to break the MVP defined in the Epic into Features or Capabilities. Independently of this, ARTs plan their own Features within their ongoing budgets.
Anyone managing a SAFe portfolio as a list of work to which resources are allocated misses the essence of Lean Budgets and a major means of avoiding poor investments and unnecessary management effort.
“Behind every failed project was a business plan that looked great on paper” (business proverb)
The foundation
Principle #1, «Take an Economic View»
The investment perspective has a sound basis in SAFe. It follows from Principle #1, «Take an Economic View». This requires every portfolio to have an Economic Framework, «a set of decision guidelines that align everyone with the financial objectives of a Portfolio» (Take an Economic View). This Economic Framework has four elements:
- Operating within lean budgets and guardrails
- Understanding solution economic trade-offs
- Leveraging suppliers
- Sequencing jobs for the maximum benefit
Lean Budgets and Guardrails are Element 1 of this framework (Lean Budgets) , (Guardrails)
Element 2 requires trade-offs between five variables that SAFe takes from D. G. Reinertsen: development expense, lead time, product cost, value and risk. Reinertsen specifies a common unit for this: everything that has economic value should be measured in terms of «life-cycle profit impact», in other words, money (Reinertsen 2009, p. 31). He calls the conversion of the individual variables sensitivities; in a footnote, he describes them as a transformation mapping the control variables into the economic space. The most important of these sensitivities is Cost of Delay, the price of time. His Principle E3 states: «If you only quantify one thing, quantify the cost of delay.» Without knowing the economic value of lead time, we cannot make meaningful trade-offs between money and time. He therefore calls Cost of Delay «the golden key that unlocks many doors» (pp. 31–32).
The SAFe article adopts these five variables. To sequence work, SAFe uses a relative CoD estimate based on the Fibonacci sequence (1,2,3,5,8,..) comprising the sum of the estimated Business Value, Time Criticality, and Risk Reduction and Opportunity Enablement for each item. This sum does not convert the five factors into a common monetary unit.
Element 3 is covered in this article through Agile Contracts.
Element 4 uses WSJF to support important considerations about the sequence in which investments consume funded capacity. These considerations must also take account of dependencies, binding deadlines and the capabilities of the Value Streams involved. A high ranking does not create available implementation capacity. I see Element 4 as the means of potentially maximising an enterprise’s profit; for me, it ties the four elements together.
Cost of Delay
WSJF in SAFe (WSJF) and WSJF as described by Reinertsen in 2009 take different approaches to determining Cost of Delay (CoD). Reinertsen defines Cost of Delay (CoD) in money per unit of time, for example CHF/week. SAFe, by contrast, uses conventional agile relative estimation and a modified Fibonacci sequence.
Reinertsen
For the WSJF value, Reinertsen divides CoD by the initiative’s duration.
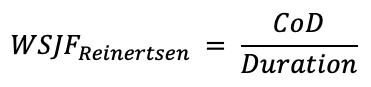
When Cost of Delay (CoD) is approximately constant, this quotient helps sequence initiatives. With deadlines, step changes or increasing losses, looking only at an initiative’s current CoD rate is not enough. We then need to compare the total loss caused by the possible delivery sequences of the initiatives under consideration. Monetary CoD also means making the time profile of the CoD curves visible: an initiative may have a low CoD today but become very expensive from day tx onwards because of penalties or step-fixed costs.
Examples of CoD curves:
Constant:
- OpEx savings from go-live without an adoption ramp-up
- Manual activities that consistently incur the same costs
Increasing linearly:
- Technical debt: subsequent changes become increasingly expensive
- Reputational risk that grows over time
Step changes in the CoD curve
- Seasonal window (campaign, year-end business, trade fair)
- Hard compliance deadline
- Contractual window (new terms apply from date X)
One can argue that Reinertsen’s approach takes considerable effort. SAFe states: «In practice, however, both numbers can be extremely difficult to estimate.» (WSJF) This refers to both Reinertsen’s CoD and duration.
SAFe
SAFe therefore uses relative measures: Business Value, Time Criticality, and Risk Reduction and Opportunity Enablement are estimated using modified Fibonacci numbers, added together and divided by relative Job Size.
UBV = User Business Value
TC = Time Criticality
OE/RR = Opportunity Enablement or Risk Reduction

In SAFe, WSJF is applied in the same way to Features, Capabilities and Epics.
WSJF risks at portfolio level
Portfolio prioritisation is more than a sequencing problem; it is an economic decision over time. Epics are highly heterogeneous by definition. They differ in when benefits arise and in how the potential economic loss from delay develops over time.
Relative numbers alone do not reveal these differences, which can lead to portfolio decisions that only appear to be correct. They are “correct” within the local WSJF logic and its local comparison group. A decision may seem plausible within that logic and still cause higher delay costs than another sequence. A constant saving forgone, an increasing loss and a hard deadline each require a different view of time.
To determine an economically optimal sequence of heterogeneous investments, we therefore need a common reference measure: monetary CoD. It makes the value lost through postponement visible and connects the sequence to the economic assumptions in the Lean Business Case (See LBC section of an Epic).
It is therefore advisable to depart from the canon for Epics. The argument «In practice, however, both numbers can be extremely difficult to estimate» (WSJF) remains valid, but carries less weight when we consider that Epics and their sequencing are among an enterprise’s central investment decisions. The necessary care and accuracy should not be an obstacle here.
Because relative estimates are valid only within the local comparison group, Reinertsen’s CoD helps make sequencing less dependent on that group. For sequencing across portfolios, it provides a commonly understood measure that transfers between contexts: money per unit of time.
Relative Fibonacci estimates within a local comparison group have their value. They work well when the items are homogeneous enough to be weighed directly against each other, for example Capabilities or Features that do not individually make a major strategic contribution or carry risk.
Tucker reaches the same conclusion: SAFe’s WSJF is «good enough for prioritising features within a Program Increment», but struggles at portfolio level. He refers to the more precise portfolio version of Cost of Delay that Reinertsen and Joe Vallone presented at the SAFe Summit 2019 (Portfolio WSJF – Part 4). Tucker argues, however, that even a more precise Cost of Delay does not solve the problem of long-term investments being crowded out because Job Size in the denominator systematically disadvantages them. Together with SAFe Fellow Ian Spence, he therefore proposes applying WSJF within each investment horizon (Portfolio WSJF – Part 6), making each horizon a local comparison group.
I do not find this argument sufficiently convincing: an initiative’s investment horizon and Job Size describe different dimensions and are rarely directly dependent on each other. The horizon describes when an investment may generate a return; Job Size describes how large the initiative is. SAFe itself says that Horizon 3 explorations «require modest funding» (Lean Budgets); they tend to be smaller. My conclusion is that a later return does not automatically disadvantage an investment through its Job Size.
The numerator, CoD, also needs attention. As shown above, monetary CoD captures time profiles and windows. What it does not value is the benefit of deferring a decision that is difficult to reverse until new knowledge is available: expand, change direction or stop. Staged decision analysis values exactly this, and it is often marketed as Real Options Analysis (ROA); SAFe proposes it in Improving Portfolio Outcomes with Real Options. Strictly speaking, option-pricing methods such as Black-Scholes only apply to market-priced risks, whereas the risks of an Epic are largely private (Borison, 2005). Reinertsen argues in the same decision-analytic way when he recommends buying information in small steps and abandoning poor paths early (Reinertsen, 2014). The two views are connected rather than additive: in a staged valuation, CoD is the loss of value caused by delay. I will explore this further in Lean-Agile Finance, Part 2.
Even a sound valuation, however, does not replace the strategic decision about how much the portfolio invests in sustaining and retiring today’s business (Horizons 0 and 1) versus future opportunities (Horizons 2 and 3). That allocation is a strategic choice in its own right and needs no justification from Job Size. My criticism therefore concerns the Job Size–based explanation, not the protection of future investments through horizons.
Whether relative or monetary: WSJF and Cost of Delay are indicators, not decision gates. They can easily tempt us to assume a level of objectivity that is not sufficiently attainable. SAFe says that, in the Portfolio Kanban Go/No-go decision, «WSJF is a factor, but there are many other things to consider» (Portfolio Kanban), and that the results of Strategic Investment Planning «do not directly determine the budget allocations» (Strategic Investment Planning). According to Tucker, Reinertsen considers «within 10%» to be «close enough for financials» (Portfolio WSJF – Part 4). On that basis, there is no difference between an Epic with a Cost of Delay of 155,000 and one with 157,000, just as there is no difference between a WSJF of 3.67 and one of 3.72.
Calling WSJF an «indicator» does not, for me, mean it is «dispensable». Tucker also quotes the same Reinertsen presentation: «Peoples intuition is poor». The value of WSJF does not lie in comparing two almost identical numbers. It lies in revealing differences that intuition misses, and in the discussion of CoD itself.
In practice, estimate ranges help us more than seemingly precise point estimates. Where loss or gain profiles over time are comparable, we can also derive ranges for WSJF values. With deadlines or step changes in the loss curve, however, we compare specific sequences and their delay costs. Discussion and strategy remain essential parts of the decision.
Stage 1 – Funding sources: SAFe takes the portfolio budget as given
The enterprise provides each Lean Portfolio with a budget governed by «organizational-level policies and practices» (AI-Native SAFe: Portfolio Outcomes and Investment Strategy). Where there are several portfolios, Enterprise Portfolio Management allocates funds to the individual portfolios using its own Guardrails (Enterprise). SAFe does not describe how this overall budget is determined. That is a matter for corporate financial planning.
SAFe allows for constraints on the allocation of funds. The community contribution Understanding Color of Money by Luke Hohmann and Nikolaos Kaintantzis gives examples:
- Earmarked funds, which may only be spent for their designated purpose.
- Legal entities, which may only fund their own Epics.
- Spending rules and deadlines, such as funds that may only be used in the current financial year.
These constraints are recorded at the outset, with their source, type and amount. They accompany the money through every subsequent stage.
One boundary matters in practice: creating a budget specifically to get a particular Epic through is labelled «Misuse 1» in the same contribution: «In SAFe, we finance the value streams, not the work items.»
This does not mean that only external constraints are legitimate. Alongside regulatory constraints, the same contribution recognises internally defined policies as legitimate, such as allocation by horizon, shares for Strategic Themes or mandatory compliance Epics. It is only the creation of funds specifically to finance a particular Epic that constitutes misuse.
Stages 2 and 3 – From the portfolio budget envelope to the Value Stream budget
The budget defines the portfolio’s financial envelope for a time horizon such as a year. The envelope is fixed, not how it is used. Joe Vallone and Claus Hirzmann’s real options contribution puts it this way: «only the budget envelope is fixed yearly, not spending allocation» (Improving Portfolio Outcomes with Real Options). Within that envelope, Portfolio Leadership allocates the budget by investment horizon, from H0 decommissioning to H3 exploration (Lean Budgets, Lean Budget Guardrails).
AI-Native SAFe also recommends a strategic reserve that can be allocated during the year (Portfolio Outcomes and Investment Strategy).
Allocation to Value Streams takes place through Strategic Investment Planning (SIP). SIP has replaced Participatory Budgeting (PB). Each Value Stream budget consists of two parts:
| Part | Content | Examples of cost types |
| Baseline Solution Investments (BSI) | Developing, operating and maintaining existing solutions, including Epics below the portfolio threshold | Salaries and overhead, contractors, suppliers, hardware and licences, corporate allocations for Shared Services |
| Proposed Solution Initiatives (PSI) | Epics above the threshold, both new and ongoing | The share of Epic costs incurred in the budget period |
Three rules make this financially manageable:
- Budget period: Value Stream budgets are set roughly every two PIs, typically twice a year.
- Period alignment: Only the share of an Epic that falls within the coming period is budgeted. For a new Epic, this initially covers only the MVP.
- Proportional allocation: If an Epic involves several Value Streams, it is split according to their respective shares. In the SAFe example, an Epic costs 800K; one Value Stream bears 200K and the other 600K.
SIP participants include Portfolio Leadership, Product and Solution Management, Epic Owners, architects and Business Owners, with Finance, Sales or other portfolios involved where needed. During the workshop, they are divided into groups of five to eight people, mixing roles and Value Streams; the SAFe article’s example has 40 people in five groups of eight (Strategic Investment Planning, section «Assemble the Participants»). Each group meets in its own forum and receives the entire portfolio budget. This budget is divided equally among the group’s members. Because nobody can fully fund a BSI or an Epic alone, participants must pool their budgets. The results from all forums are then compared. The outcome is a recommendation. Portfolio Leadership makes the decision in the Strategic Portfolio Review. This decision takes effect with the next PI. Investments from earlier budget periods are treated as sunk costs and disregarded in the decision: «Previous investments from a prior budgeting period are sunk costs and ignored by LPM during decision-making» (Strategic Investment Planning).
Stage 4 – Within the Value Stream: money becomes capacity
Within the Value Stream, the unit of consideration changes from money to capacity.
The budget funds a fixed amount of capacity for a series of PIs (Transitioning to Value Stream Funding). Capacity costs per PI are therefore largely fixed and readily forecast. If a Feature consumes more capacity than originally expected, the budget does not change (Lean Budgets). Funding capacity means funding the standing workforce, licences, workplaces and everything else needed to deliver value to the customer.
Management works through shares of capacity:
- Capacity Allocation: For each PI, the shares allocated to new Features, Enablers, technical debt and maintenance are defined (Lean Budget Guardrails). SAFe gives examples such as no more than 25% for Run-the-Business or 50–70% for Features from Epics (Transitioning to Value Stream Funding, Table 1).
- Epics as a «tax»: An Epic that affects all Value Streams is not funded separately. Value Streams receive their budgets on condition that they devote part of their capacity to it (Color of Money).
- Business Owners: In PI Planning, System Demo and Inspect & Adapt, they ensure that funded capacity goes into the right work (Lean Budget Guardrails, Guardrail 4).
A hard limit applies to Epics. The Epic Owner develops the MVP budget with stakeholders and sets it out in the Lean Business Case. Portfolio Leadership makes the Go/No-go decision in the Portfolio Sync (Epic Owner, Portfolio Kanban). Once the MVP has been approved, the Epic may not exceed this budget. If an overrun becomes apparent, the Epic Owner must report it to Portfolio Leadership (Epic). The MVP tests the Epic’s business outcome hypothesis using leading indicators. Implementation continues until the hypothesis can be assessed or the MVP budget is exhausted (Portfolio Kanban).
The Epic Owner brings the relevant data, evidence and recommendation to the Strategic Portfolio Review, where Portfolio Leadership decides whether to Persevere, Pivot or Stop (Validating Investment Opportunities, Step 3). With Persevere, the Value Stream funds further work from its budget, prioritised using WSJF in the ART Backlog; if the remaining costs exceed the threshold, they enter the next SIP as a Proposed Solution Initiatives (PSI). If the MVP budget is exhausted and the decision is to Pivot, a new Epic is required. Unspent funds return to the Portfolio; earmarked funds retain their restrictions (Color of Money).
As stated above I therefore understand an Epic as an investment decision that authorises the consumption of capacity. Its budget is included in the Value Stream budget and implemented through shares of capacity. Unlike a project, it has no separate work breakdown structure or account.
Tucker shares this reading. He criticises the language of the former practice of Participatory Budgeting for giving the impression that Epics receive money. In fact, Value Streams are funded so that they will later have capacity for the Epic (Participatory Budgeting). It follows that budgeting is not approval. An Epic included in SIP may still fail to gain approval. The money then stays with the Value Stream and goes into other investments. According to Tucker, SIP only needs an Epic that has completed Review in the Portfolio Kanban, bringing a hypothesis and initial estimates. Producing the full Lean Business Case solely for SIP would be waste.
This leads to a second point from Tucker: a budget change takes time to have an effect (Value Streams). The decision to give a Value Stream more or less money can be made quickly. But because almost all of that money is tied up in people, capacity changes only when people have been hired, brought up to speed or let go. That can easily take months.
A quick response is possible, however, by changing how existing capacity is used now: the Epics and Features that consume it can be reprioritised at every PI boundary. Tucker therefore advises treating agreed budgets for the current period as fixed and implementing short-term strategy changes through prioritisation.
Stage 5 – Use of funds: spending and attribution to work
In SAFe, budgeting means reserving funds, not spending them. The Color of Money contribution explicitly separates the two: Portfolio Leadership might reserve €14 million for a Value Stream, while Finance releases funds monthly as expenditure arises (Color of Money, «Dysfunction 3»). Supplier payment schedules, for example for advance payments, can therefore differ from the cadence of portfolio decisions.
Tucker distinguishes three decisions, each influencing the next (Flow of Money):
- Investment: The portfolio decides how much goes into which solution space and therefore which Value Stream.
- Spending: The Value Stream decides what to spend the money on: internal or external people, licences, infrastructure and tools.
- Consumption: The capacity created in this way is allocated to work through the backlog and Capacity Allocation.
Tucker made this distinction in response to a client who equated spending on internal staff with capacity reserved for operations and support. My reading is this: whether someone is employed internally or contracted externally is a spending decision (Level 2). What their working time is used for, new Features, internal improvements, or operations and support, is a consumption decision (Level 3). Internal staff can build new Features; external staff can provide support. The reserve for operations and support is a share of total capacity, not a particular block of people.
For external suppliers, SAFe recommends Agile Contracts. These contain an initial funding commitment for a number of PIs, for example two, and at each subsequent PI boundary a decision can be made to increase, maintain or phase out funding (Agile Contracts).
To make it clear in subsequent reporting and management control where the funds have gone, the funding source is recorded directly against the relevant work items (the use of funds):
- Funding codes: Finance representatives take part in Backlog Refinement and assign a code to each backlog item. The government article leaves the level unspecified; the Color of Money contribution names the backlogs of Value Streams, Solution Trains and ARTs. This code accompanies the item throughout its lifecycle in the Agile Lifecycle Management (ALM) tool (Adopting Lean Budgeting Aligned to Development Value Streams). The Color of Money contribution recommends a metadata system designed by Finance in advance.
- CapEx tagging: Accounting and Product Management jointly determine which Features can or must be capitalised, and the relevant Features are tagged. The amount eligible for capitalisation is determined using hours, story points or simply the number of Stories per category (CapEx and OpEx).
- Cost per Feature: Because an ART’s costs are fixed, the capacity consumed can be attributed to the Features delivered (Adopting Lean Budgeting).
Stage 6 – Reporting and feedback
SAFe provides individual building blocks for reporting, but no overall framework. The «Measuring Portfolio Performance» competency has been announced but has not yet been published (LPM Discipline).
| Building block | What is reported | Source |
| CapEx/OpEx | The share of work eligible for capitalisation in each period | CapEx and OpEx |
| Planned versus actual per Feature | The idea is to compare actual costs and capacity consumed per Feature with planned values («can be compared») and derive a «predictability index» that is not further defined. This should not be confused with SAFe’s Predictability Measure, which measures the Business Value of PI Objectives | Adopting Lean Budgeting |
| Funding codes | Forecasts, allocations and spending by funding source | Color of Money |
| Value Stream KPIs | Revenue, margin, usage; for Value Streams that are purely cost centres: absolute costs and the ratio of new development to maintenance | Value Stream KPIs |
| ROI | Forecast versus actual ROI at each level | AI-Native SAFe: Return on Investment |
| OKRs and KPIs | Progress, at least quarterly alongside financial data | LPM Discipline |
I consider planned-versus-actual comparison per Feature a mistake when adherence to effort estimates becomes a performance target or a variance triggers new approvals. This is the form of control criticised by the 2013 white paper. A Feature that takes longer does not automatically change the PI budget when capacity is already in place; it may, however, displace other work or stretch capacity in the IP Iteration.
A lightweight comparison can therefore help improve forecasts and understand capacity consumption. It still measures something different from the Predictability Measure: the quality of the effort estimate rather than achievement of the agreed PI Objectives, assessed by their Business Value.
For investment management, what matters is capturing the actual cost per Epic against the business benefits achieved. In Tucker’s words, «have we got value for the money/effort that the work has consumed?» (Estimating Effort or Expense?). Each company must weigh the value of collecting actuals at Feature or Story level against the effort involved. In practice, I would argue against it unless evidence requirements or earmarking constraints require otherwise.
The Value Management Office (VMO) collects this data and brings it into portfolio events (VMO). For me, this also requires a named person accountable on the business side. Once development work has ended, who checks through the lagging indicators whether the expected benefits actually materialise? The VMO consolidates the information; accountability for benefits remains with the Epic Owner.
The monthly Portfolio Sync addresses progress and KPIs. Budgets are adjusted in the quarterly Strategic Portfolio Review (Lean Governance). The results feed into the next Strategic Investment Planning (SIP). The cycle begins again there, as noted, without regard to sunk costs.
From capacity back to money: the 2013 white paper
The canon currently says little about how to turn capacity consumed back into money per Epic. The original white paper by Rami Sirkia and Maarit Laanti from 2013, which later gave rise to SAFe’s Lean Budgets, is more concrete. Sirkia was a financial planner and Laanti an Agile Coach in the same R&D unit. Their paper is a case report, not a formal method.
Starting point. The R&D planners had to provide 18-month estimates, expressed in person-months per project and person and updated monthly. Only the specialists themselves could explain why the numbers changed. A catalogue of investment profiles by Feature type never became accurate enough to support management decisions.
The solution separates two views of the same money:
- Cost centre view, at an aggregate level and in monetary terms. Rolling 13-month forecasts were no longer produced for cost centres of 30–50 people, but only one or two levels higher, covering 300–500 people. Finance tracked the operating cost run rate at that level. Because almost all costs were personnel costs, this figure was stable across periods. Investments in development environments and prototypes were added and planned once backlog priorities were established.
- Initiative view, in detail and in terms of effort. A small number of experienced planners centrally estimated an effort profile for each Epic. These profiles were used to calculate how operating costs were distributed across initiatives. The result was, in the authors’ words, «an investment number next to a list of items» for R&D management and ad hoc analyses. The cost centre plans were produced only afterwards, derived from this view.
The estimates were explicitly not commitments. They were not agreements on resources, consumption or scope. From four to six months into the future, planners were allowed to show capacity as «unallocated» rather than hide uncertainty.
Actuals come from the backlog. After each increment (then called PSI, now PI), the Team Backlog shows how many days each person worked on which Feature. In the unit, each Feature corresponded to exactly one initiative, allowing the cost per Epic to be read off. There was no requirement for individual time tracking. To establish costs per Epic, the authors therefore used the resource data already being collected.
What disappeared: project budgets, variance analyses against the original plan and renewed approvals following delays. If an initiative needed more effort, its priority remained high and it «automatically» drew in more capacity. The unit’s total costs did not change; only the lowest-priority initiatives did not get capacity.
In calculation terms, this amounts to a cost allocation in my view. An Epic’s cost in a period is approximately its share of capacity consumed multiplied by the unit’s full costs in that period. The paper does not state this formula explicitly, but it follows from the underlying logic. Finance then needs two numbers per period rather than project accounting: the unit’s run rate and the distribution of capacity from the backlog.
Tucker makes this conversion explicit (Estimating Effort or Expense?). An ART’s PI costs and historical velocity provide a conversion factor between effort and attributed costs. If several ARTs contribute, the calculation is made separately for each and then summed. The calculation shows the monetary value of capacity consumed, not the amount actually saved if work stops. For cost attribution:

Tucker recommends estimating effort and converting it into money, not the other way round. The conversion factor is not fixed: with better know-how, architecture and Delivery Pipeline, the same ART delivers more value for the same money.
Additional operating costs of the solution implemented through an Epic are added. Operating costs such as cloud subscriptions or licences increase future BSI. The Value Stream funds one-off costs from its budget.
Current open questions
Funding sources for internal customers
This concerns Development Value Streams whose customers are internal business functions, such as an IT or platform organisation. They have no revenue source of their own. Luke Hohmann makes the general point in his talk Creating Profitable Value Streams: a company cannot make a profit from internal customers. Their money therefore comes either centrally from the portfolio budget or from the business functions that use their services.
SAFe describes the first route, but not the second. The Portfolio article mentions internal transfer prices between separate legal entities as overhead. In my view, that covers only a small part of the financial reality of corporate groups. For shared solutions, it proposes a separate platform portfolio that treats business functions as customers and, where possible, has its own revenue targets. It identifies a challenge: business leaders struggle to secure funding for their requests to the platform. Their requests then compete with Epics or Features that generate revenue for the platform itself.
In my view, SAFe is describing a prioritisation conflict between two sources of demand: requests from business functions and the platform’s own revenue-generating Features. SAFe has a tool for such conflicts that requires no flow of money: Capacity Allocation. Product Management can, for example, reserve a fixed share of capacity for business requests, just as it allocates shares to Enablers and Architectural Runway (Lean Budget Guardrails, Guardrail 2). SAFe does not describe a funding route from the business function to the platform; the passage does, however, show that such a route is not needed to address this conflict.
Outside the canon, Tucker describes three alternative sources of funds:
- Types of funding source: A portfolio funds itself from its own revenue and is then free to decide how to use it. Or it receives money «from on-high … or other parts of the business» and must meet the associated expectations of results. The most problematic case is money tied firmly to work (Purpose of LPM).
- Participatory Budgeting with contributed funds: When units bring their own money, their representative in the forum receives exactly the amount contributed rather than an equal share. To prevent funders from financing only their own initiatives, a PSI is accepted only if its associated BSI is adequately funded (Participatory Budgeting).
- Investing in other portfolios: Country portfolios fund a shared solution portfolio by investing in its solutions. If there is no demand, a solution is not funded. Guidelines ensure a minimum level of funding (Combined Portfolios). Tucker, however, calls internal charging for small pieces of work between portfolios an anti-pattern (Multiple Portfolios).
Calculation method
SAFe states that costs per Feature can be derived from capacity consumed. How to calculate them is described in the 2013 white paper and by Tucker, rather than in the canon (see Stage 6).
An overall reporting framework
The building blocks in the Stage 6 table come from five SAFe articles and one community contribution (Color of Money), dated between 2022 and 2026. There is no coordinated reporting model for Finance while «Measuring Portfolio Performance» is still missing.
I consider the gaps in funding sources and the calculation method editorial rather than conceptual: answers exist in the SAFe ecosystem, in the 2013 white paper and from a SAFe Fellow; they have simply not made their way into the canon. Financial reporting is different: here, an answer is also missing outside the canon. Tucker describes Business Outcomes and Flow, but no coordinated financial reporting model (Funding and Reporting). Whether this gap is editorial or conceptual will only become clear with «Measuring Portfolio Performance».
Strategic Investment Planning (formerly Participatory Budgeting) may fail in practice if the portfolio budget is assembled from funders’ contributions and those funders finance only their own initiatives. SIP itself does not address this: it assumes that the organization provides a pooled portfolio budget, and the forums allocate notional shares of it. The risk therefore sits upstream, in the sourcing of funds. In that case, funding sources for internal customers would indeed be a structural problem. Tucker identifies this risk; I found no empirical data on how often it occurs.
Practice
A point up front, and here I depart from SAFe: the practical example below, CVS Health, which SAFe references in the Lean Budget Guardrails, is not an example of Lean-Agile funding. It shows a transitional arrangement:
Delivery is organised in an agile way, while funding sources still follow established project logic. Taking this example as a model reintroduces precisely the project logic that Lean Budgets are meant to remove, denying the organisation a major economic benefit of a SAFe transformation.
CVS Health
CVS Health presented its approach at the SAFe Summit 2020 (Video), about a year and a half after starting. The Digital Pharmacy portfolio, with more than five ARTs, was funded by several business units. The money came with commitments running to year-end, which CVS itself calls «IOUs». The portfolio created three Guardrails of its own: allocation by benefiting business unit, outstanding commitments per initiative, and Run versus Dev. Data was captured at Feature level in the ALM tool and evaluated after each PI.
Three characteristics show project logic returning through the back door:
- Budget tracking per initiative: Management focuses on the remaining balance of a commitment («51 % of our commitment remaining»), not on benefits.
- Predetermined solutions: Mandatory work arrives from the funder with the solution already defined. The teams described themselves as «worker bees».
- Funders steer instead of the portfolio: An ART’s freely available capacity depended on how many commitments it carried. The portfolio did not prioritise this.
This is exactly what the Color of Money contribution calls «Misuse 1». CVS recognised the problem itself and planned to work with funders early on to develop solutions in 2021.
The contrasting example comes from Brian Tucker’s account of an investment bank (Aligning Around Value). There, too, projects fund an ART: two or three large banking projects plus a block for operations. The difference is not where the money comes from, but what it commits the ART to. The blocks are large and fund outcomes, not individual Features. Within these constraints, the ART negotiates and makes its own choices.
For organisations where business functions fund IT, this raises four questions for Finance and Portfolio Leadership:
- Which constraints are legitimate? The Color of Money contribution allows for external constraints (law, regulation, legal entity) and portfolio-wide policies (horizons, Strategic Themes, compliance). It calls money created specifically for a particular initiative a misuse.
- What is fixed: the outcome or the solution? A funder who finances an outcome and leaves the solution open preserves the Value Stream logic.
- How is the funding source carried through? Funding codes assigned to backlog items by Finance during refinement make funding sources reportable at Feature level without project accounting.
- Are the cadences aligned? The financial year, budget period, payment schedules and fund release cycles should be explicitly aligned. SAFe recommends first mapping the existing financial process with the CFO (Transitioning to Value Stream Funding, Step 1).
Sources
All SAFe articles accessed in October 2026; dates shown in brackets are those stated in the articles.
SAFe Framework and Knowledge Base
- Lean Portfolio Management Discipline (March 2025)
- Transitioning to Value Stream Funding Competency (February 2026)
- Strategic Investment Planning (May 2026)
- Lean Budgets (October 2023)
- Lean Budget Guardrails (October 2023)
- Epic (March 2025)
- Epic Owner (June 2023)
- Enterprise (April 2025)
- Portfolio (April 2025)
- Lean Governance (March 2025)
- CapEx and OpEx (December 2025)
- Value Management Office (October 2023)
- Value Stream KPIs
- Agile Contracts (February 2023)
- Adopting Lean Budgeting Aligned to Development Value Streams (November 2022)
- AI-Native SAFe: Portfolio Outcomes and Investment Strategy (June 2026)
- AI-Native SAFe: Return on Investment (June 2026)
- Principle #1 – Take an Economic View
- Weighted Shortest Job First
Community contributions on framework.scaledagile.com
- Hohmann, L. & Kaintantzis, N. Participatory Budgeting: Understanding Color of Money and Other Constraints (September 2023)
- Vallone, J. & Hirzmann, C. Improving Portfolio Outcomes with Real Options (September 2023)
- Sirkia, R. & Laanti, M. Lean and Agile Financial Planning – Original White Paper (December 2013)
Brian Tucker, Ivar Jacobson International (blog, approximately 2020–2025)
- On the Nature of Portfolios: Managing Investment – Value Streams
- On the Nature of Portfolios: Participatory Budgeting
- On the Nature of Portfolios: Managing Investment – Flow of Money
- On the Nature of Portfolios: Managing Investment – Estimating Effort or Expense?
- On the Nature of Portfolios: Purpose of Lean Portfolio Management – Solution Focused
- Combined Portfolios
- Multiple Portfolios
- Organizing Around Value: Aligning Around Value
- Organizing Around Value: Funding and Reporting
- On the Nature of Portfolios: Portfolio WSJF – Part 4
- On the Nature of Portfolios: Portfolio WSJF – Part 6
Book
- Reinertsen, D. G. (2009). The Principles of Product Development Flow: Second Generation Lean Product Development. Redondo Beach, CA: Celeritas Publishing. Chapter «The Economic View», pp. 31–32.
Talks
- Hohmann, L. Creating Profitable Value Streams (SAFe Summit)
- Davis, R. & Gold, E. Implementing Lean Budget Guardrails at CVS Health (SAFe Summit 2020)
Other
- Reinertsen, D. Rethinking Robustness, 2014
- Borison, A. (2003): Real Options Analysis: Where are the Emperor’s Clothes?
About the author
Ilja Thieme studied business administration, holds the German Diplom-Kaufmann qualification and has a Master in Business Management. He is Managing Partner of Yes and Why GmbH and an Advanced SPC. For more than a decade, he has worked on agile transformations in large and international companies. As head of the LACE, he is currently supporting the SAFe transformation of a large Swiss enterprise. In doing so, he translates SAFe into the organisation’s language, including the language of Finance. His professional roots are in ICT and product development. He writes about management, leadership, agility and AI.

Related Posts
High-Performance Teams Thanks to Agile Transformation
In an era when companies must constantly face new challenges, effective teamwork plays a crucial role. Here is where Yes and Why GmbH comes in, a consultancy that specializes in transforming less effective teams into high-performance teams through agile transformation. Want to learn more about what an agile mindset truly means? Read our detailed article…
Lean-Agile Finance (1)
How money flows through SAFe: from funding sources via Lean Budgets and capacity to reporting. Canon, community and own position kept apart.
The hidden costs of „Calender-Tetris“
TL;DR If your agile transformation feels like “even more meetings,” that’s often not a mindset problem. It’s a structural one. Frequent context switching creates switching costs. People are busy, but delivery slows down. Scrum can improve this—but only if you don’t pile it on top of project governance. The lever is calendar and coordination design:…
Prime Directive 2025: A modern foundation for safe and effective retrospectives
Modern teams need a Prime Directive that goes beyond good intentions. The new version creates real learning space: safe, confidential and grounded in clear ethics.
Subscribe Here!